
The Union Cabinet, on 4 November 2026, approved the Viksit Bharat Initiative for Statistical Transformation, Analytics and Research (VISTAR), a Central Sector Scheme designed to modernise India’s official statistical system.
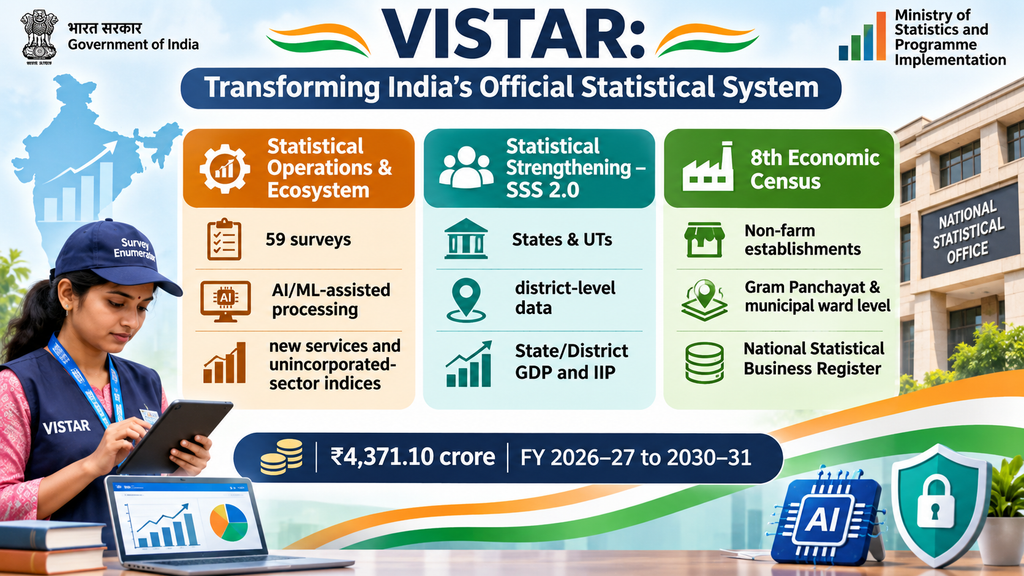
The scheme will be implemented during 2026–27 to 2030–31, with a total financial outlay of ₹4,371.10 crore. It aims to establish a dynamic, digitally integrated and artificial intelligence-ready statistical architecture capable of generating more timely, reliable and granular data for policymaking.
The initiative is significant because the quality of public policy depends heavily on the quality of the information on which decisions are based. Reliable statistics are essential for estimating economic growth, measuring inflation, assessing employment, identifying regional inequalities, monitoring welfare programmes and evaluating developmental outcomes.
VISTAR seeks to address several long-standing challenges in India’s statistical ecosystem, including data gaps, delays in data generation, uneven statistical capacity across States, fragmented databases and limited availability of disaggregated information.
The scheme also proposes the 8th Economic Census, expanded national surveys, new economic indicators, greater use of alternative data sources and the integration of artificial intelligence and machine learning into statistical processes.
It therefore represents an important institutional reform in India’s journey towards evidence-based governance and the developmental objectives of Viksit Bharat 2047.
1. Why Does India Need Statistical Transformation?
Statistics are not merely numerical representations of economic and social conditions. They form the foundation of public administration, economic planning and democratic accountability.
Governments use official statistics to:
- Estimate Gross Domestic Product (GDP) and economic growth.
- Measure inflation and changes in the cost of living.
- Assess employment, unemployment and labour-force participation.
- Measure poverty, consumption and household living conditions.
- Monitor industrial production and agricultural output.
- Assess the performance of welfare schemes.
- Identify regional and social inequalities.
- Allocate public resources and formulate development policies.
For example, a government seeking to design an employment programme needs reliable information about the number of unemployed people, the nature of employment, regional variations and the characteristics of the workforce.
Similarly, estimating district-level poverty or identifying areas with low industrial activity requires data at a level more detailed than national or state averages.
1.1 Limitations of the existing statistical ecosystem
India has developed a substantial official statistical system through the Ministry of Statistics and Programme Implementation (MoSPI), the National Statistical Office (NSO), State Directorates of Economics and Statistics and other government institutions.
However, several structural challenges remain.
1. Data gaps: Some sectors and economic activities are not adequately captured by existing surveys, particularly parts of the unincorporated and informal economy.
2. Delays in data availability: Conventional survey design, fieldwork, processing, validation and publication can take considerable time.
3. Limited geographical granularity: Many important statistical indicators are available at national or state levels but are not consistently available at district, city or local levels.
4. Uneven state-level capacity: States and Union Territories differ in their statistical infrastructure, trained personnel, technological capabilities and institutional resources.
5. Fragmented databases: Data generated by different institutions may use different classifications, definitions, formats and reporting systems, making integration difficult.
6. Changing economic structures: Digital platforms, e-commerce, new business models and service-sector activities require statistical methods that can capture economic activity more effectively.
7. Limited use of alternative data: Administrative databases, digital transactions, scanner data and other non-traditional sources can complement conventional surveys but require appropriate methodological and legal safeguards.
VISTAR seeks to address these challenges through a combination of institutional strengthening, technological modernisation and expanded statistical operations.
2. What is the VISTAR Scheme?
The Viksit Bharat Initiative for Statistical Transformation, Analytics and Research (VISTAR) is a Central Sector Scheme under the Ministry of Statistics and Programme Implementation.
| Particular | Details |
|---|---|
| Full name | Viksit Bharat Initiative for Statistical Transformation, Analytics and Research |
| Approval | Union Cabinet, 4 November 2026 |
| Nodal ministry | Ministry of Statistics and Programme Implementation |
| Nature | Central Sector Scheme |
| Implementation period | 2026–27 to 2030–31 |
| Total outlay | ₹4,371.10 crore |
| Primary objective | Modernisation and strengthening of India’s official statistical system |
| Major focus areas | Digitalisation, AI/ML, surveys, state statistical capacity and Economic Census |
The scheme is aligned with the broader objective of Viksit Bharat 2047.
It seeks to build an official statistical architecture that is:
- Timely.
- Reliable.
- Granular.
- Interoperable.
- Digitally integrated.
- Capable of using emerging analytical technologies.
- Responsive to changing policy requirements.
VISTAR is not simply a technology procurement programme. It seeks to improve the entire statistical process, from data collection and processing to validation, analysis, dissemination and utilisation.
3. Three Major Components of VISTAR
The scheme has three principal components.
- Comprehensive Statistical Operations and Strengthening of Ecosystem.
- Support for Statistical Strengthening (SSS 2.0).
- Economic Census.
<caption>Structure of the VISTAR Scheme</caption>
| Component | Major objective |
|---|---|
| Comprehensive Statistical Operations and Strengthening of Ecosystem | Expand surveys, modernise statistical processes and introduce new indicators |
| Support for Statistical Strengthening (SSS 2.0) | Improve statistical capacity of States and Union Territories |
| Economic Census | Conduct the 8th Economic Census and develop a National Statistical Business Register |
These components address different but interconnected weaknesses in India’s statistical system.
4. Component I: Comprehensive Statistical Operations and Strengthening of Ecosystem
This component focuses on strengthening the central statistical system and modernising the way official data are collected, processed, validated and disseminated.
It includes several important initiatives.
4.1 Expansion of national surveys
MoSPI proposes to conduct 59 surveys during the 16th Finance Commission cycle, compared with 43 major surveys conducted during the previous cycle.
The expansion is intended to fill data gaps across different sectors and improve the availability of information for policy formulation.
Large-scale national surveys are important because administrative records alone cannot provide a complete picture of the population.
For example, information on household consumption, employment, working conditions and living standards often requires specially designed surveys.
The expansion of survey operations is expected to improve the depth and coverage of official statistics.
4.2 End-to-end digitalisation of statistical processes
VISTAR seeks to strengthen the digitalisation of the entire statistical value chain.
This includes:
- Digital collection of information.
- Electronic transmission of survey data.
- Automated validation and consistency checks.
- Digital processing and tabulation.
- Improved data storage and management.
- User-oriented dissemination of statistical information.
Digitalisation can reduce manual errors, improve processing efficiency and make information available more quickly.
However, digital systems must be supported by appropriate field verification, methodological standards and data-quality checks.
4.3 Integration of Artificial Intelligence and Machine Learning
The scheme proposes to integrate Artificial Intelligence (AI) and Machine Learning (ML) into regular statistical workflows.
Their principal proposed applications include:
- Data processing.
- Data validation.
- Data analysis.
AI-assisted systems can help identify anomalies, detect inconsistent entries, classify large datasets and analyse complex relationships.
Machine-learning techniques can also support the processing of large volumes of unstructured or semi-structured information.
For example, algorithms may identify unusual patterns in survey responses or flag inconsistencies that require further examination.
However, AI-generated results cannot automatically be treated as official statistical findings. Human oversight, transparent methodologies, reproducibility and independent quality checks remain essential.
4.4 Introduction of new statistical indicators
VISTAR proposes the development of new indicators to improve measurement of India’s changing economic structure.
Two important proposed indicators are:
A. Headline Index of Services Production
India’s services sector accounts for a substantial share of economic activity. However, measuring short-term changes in service-sector output is challenging because services are diverse and often intangible.
A dedicated Index of Services Production is intended to strengthen the measurement of changes in services-sector activity.
It can improve the understanding of sectoral trends and complement existing macroeconomic indicators.
B. Index of Unincorporated Sector Enterprises
A significant proportion of India’s economic activity takes place through unincorporated enterprises, including small businesses, household enterprises and other establishments that do not operate as incorporated companies.
The proposed index is intended to improve the measurement of activity in this segment.
It can provide information on the performance of enterprises outside the organised corporate sector and strengthen the evidence base for policies relating to MSMEs, informal employment and entrepreneurship.
The detailed methodology, coverage and publication arrangements for these proposed indices will be important for assessing their eventual usefulness.
4.5 Use of alternative data sources
One of the important features of VISTAR is the proposed use of alternative data sources to complement conventional statistical surveys.
The identified sources include:
- Mobile phone data.
- Scanner data.
- E-commerce data.
These sources can provide information on economic and social activity that may not be fully captured through traditional surveys.
For example:
- Mobile phone data may help analyse mobility patterns and population movement, subject to appropriate safeguards.
- Retail scanner data may provide information about sales patterns and changes in consumption.
- E-commerce data may provide insights into online transactions, product demand and market trends.
Such information can supplement traditional surveys, reduce respondent burden and help fill data gaps.
However, alternative data cannot automatically replace probability-based surveys. Their coverage may be selective, and they may exclude people who are not digitally connected or whose economic activity is not captured by the relevant platform.
Therefore, methodological validation and representativeness are essential.
4.6 Data harmonisation and interoperability
The scheme emphasises several foundational principles of modern data governance:
- Data cataloguing.
- Machine readability.
- Interoperability.
- Data-sharing protocols.
- Privacy by design.
Interoperability refers to the ability of different databases and digital systems to exchange and use information in a consistent manner.
For example, if different government departments maintain information using incompatible formats and classifications, combining the data becomes difficult.
Common standards and metadata can improve integration and reduce duplication.
The emphasis on privacy by design is equally important. Personal information must be protected through appropriate safeguards throughout the data lifecycle.
5. Component II: Support for Statistical Strengthening – SSS 2.0
India’s statistical system is not limited to the Central Government.
State governments collect and compile a wide range of information relating to agriculture, industry, employment, prices, public finance and social development.
State-level statistical institutions are therefore essential for generating reliable sub-national data.
The second component of VISTAR seeks to strengthen these institutions through a redesigned framework called Support for Statistical Strengthening 2.0 (SSS 2.0).
5.1 Why is state-level statistical strengthening necessary?
India’s economic and social conditions vary significantly across States and Union Territories.
National averages can conceal important regional differences.
For example, national unemployment data may not adequately reflect variations among districts. Similarly, state-level GDP figures may not reveal differences between industrial districts, agricultural districts and urban centres.
For effective decentralised planning, policymakers require information at more disaggregated levels.
5.2 Major objectives of SSS 2.0
The component seeks to:
- Strengthen State and UT statistical departments.
- Improve the availability of district-level information.
- Develop indigenous data-processing capabilities.
- Improve statistical infrastructure.
- Support localised policymaking.
- Strengthen the compilation of State and District Domestic Product.
- Improve the quality and comparability of statistical information.
5.3 District-level and city-level estimates
MoSPI will provide technical support for generating district-level estimates and estimates for cities with populations of one million or more in selected national surveys.
The identified survey areas include:
| Survey | Major area covered |
|---|---|
| Periodic Labour Force Survey (PLFS) | Employment and unemployment |
| Household Consumption Expenditure Survey (HCES) | Household consumption and expenditure |
| Annual Survey of Unincorporated Sector Enterprises (ASUSE) | Economic activity of unincorporated enterprises |
The scheme also aims to strengthen the compilation of:
- State Domestic Product.
- District Domestic Product.
- State-level Index of Industrial Production.
5.4 Importance for cooperative federalism
Statistical strengthening is an important aspect of cooperative federalism.
States require reliable data to identify development gaps, formulate budgets and evaluate programmes.
The availability of comparable district-level information can also improve the quality of intergovernmental discussions on resource allocation.
For example, more reliable district-level employment data can help governments identify areas requiring targeted skilling, infrastructure and employment interventions.
Thus, SSS 2.0 seeks to strengthen the statistical foundations of decentralised development.
6. Component III: The 8th Economic Census
The third component of VISTAR is the conduct of the 8th Economic Census in collaboration with State and Union Territory governments.
The Economic Census is an important source of information on establishments engaged in economic activities across the country.
It provides information on the number, location, nature and other characteristics of economic establishments, including those in the unorganised sector.
6.1 What is an Economic Census?
An Economic Census is a comprehensive enumeration of establishments engaged in economic activities, excluding crop production and plantation, within the defined scope of the census.
It seeks to capture information about:
- Number of establishments.
- Nature of economic activity.
- Ownership characteristics.
- Geographical distribution.
- Employment and workers engaged.
- Other relevant establishment-level characteristics.
Unlike a population census, which focuses on individuals and households, an Economic Census focuses on economic establishments.
6.2 Why is the 8th Economic Census important?
India has a large and diverse non-farm economy.
A significant number of enterprises operate outside the formal corporate structure. These include household businesses, small shops, workshops, service providers and other unincorporated establishments.
Many such units are important sources of employment and income but may not be adequately represented in conventional enterprise databases.
The 8th Economic Census is intended to generate granular information on non-farm establishments and the workers employed by them.
The proposed geographical coverage extends to:
- Gram Panchayat level.
- Municipal ward level.
This can improve the availability of local economic information for planning and policy formulation.
6.3 National Statistical Business Register
An important outcome envisaged under the Economic Census component is the development of a National Statistical Business Register (NSBR).
A Statistical Business Register is a structured database containing information on economic enterprises and establishments.
It can serve as a sampling frame for enterprise surveys and provide a consistent foundation for statistical analysis of businesses.
The proposed register can help:
- Identify economic establishments.
- Improve the design of enterprise surveys.
- Reduce duplication in data collection.
- Improve coverage of small and unincorporated businesses.
- Support targeted policy interventions.
- Strengthen the estimation of the unorganised sector’s contribution to GDP.
The register is therefore important for improving the measurement of India’s business and enterprise landscape.
6.4 Significance for the unorganised sector
The unorganised sector contributes significantly to employment, livelihoods and economic activity.
However, its dispersed nature and diversity make measurement difficult.
The Economic Census can help generate a more comprehensive establishment-level database.
Such information can improve the understanding of:
- Geographical concentration of small businesses.
- Distribution of economic activities.
- Employment patterns.
- Rural non-farm enterprises.
- Small-scale manufacturing and services.
- Regional differences in enterprise development.
This information can support the design of policies for MSMEs, entrepreneurship, credit access, skilling and local economic development.
7. How VISTAR Can Improve India’s Macroeconomic Measurement
The significance of VISTAR extends beyond administrative modernisation. It has implications for the quality of India’s macroeconomic statistics.
7.1 GDP estimation
GDP measures the value of final goods and services produced within an economy during a specified period.
Its estimation requires information from different sectors, including agriculture, manufacturing, construction, services and government activities.
Improved surveys and better coverage of unincorporated enterprises can strengthen the statistical inputs used for national accounts.
The Economic Census and enterprise-level databases can also improve the sampling frames used for economic surveys.
7.2 Employment statistics
Employment data are essential for understanding labour-market conditions.
The expansion of survey coverage and improvement in district-level estimates can provide a more detailed picture of:
- Labour-force participation.
- Worker-population ratios.
- Unemployment rates.
- Nature of employment.
- Rural and urban employment patterns.
- Regional disparities.
This can help policymakers design more targeted employment and skilling interventions.
7.3 Inflation and consumption
Household consumption data are important for understanding living standards and constructing consumption-based measures.
Alternative data sources may provide supplementary information on retail activity and changing consumption patterns.
However, such data must be carefully assessed before being incorporated into official statistical estimates.
7.4 Industrial and services-sector performance
The proposed new indicators can strengthen the measurement of sectors that are not adequately represented by existing short-term indicators.
The services sector is particularly important because its diversity makes direct measurement difficult.
A dedicated Index of Services Production could help improve the monitoring of short-term service-sector activity.
8. VISTAR and Evidence-Based Governance
Evidence-based policymaking means formulating, implementing and evaluating public policies using reliable information and systematic analysis.
VISTAR can contribute to this approach in several ways.
Better identification of beneficiaries: More granular data can help identify geographical and socio-economic groups requiring targeted interventions.
Improved resource allocation: District-level indicators can help governments direct resources towards areas with greater developmental needs.
Monitoring of outcomes: Reliable baseline and follow-up data can improve the evaluation of government programmes.
Reduction in duplication: Harmonised databases can help identify overlapping schemes and reduce repeated data collection.
Greater transparency: Improved statistical dissemination can enable researchers, citizens and institutions to assess policy outcomes.
However, data availability alone does not guarantee good governance. Statistical information must be used transparently, and policy decisions must remain subject to democratic accountability.
9. Challenges and Concerns in Implementing VISTAR
Although VISTAR has the potential to strengthen India’s statistical system, its success will depend on implementation.
9.1 Data quality and reliability
The use of new data sources and digital systems must not compromise accuracy.
Official statistics require consistent definitions, reliable sampling, appropriate validation and transparent methodologies.
9.2 Digital divide
The use of mobile phone, scanner and e-commerce data may create representational gaps.
People and enterprises that are less digitally connected may remain underrepresented.
9.3 Privacy and data protection
Combining different datasets can create risks of re-identification and misuse of personal information.
Strong safeguards are necessary, including data minimisation, access controls, anonymisation where appropriate and secure data-sharing protocols.
9.4 Uneven state capacity
States differ in their availability of trained statisticians, digital infrastructure and institutional capacity.
Without adequate training and technical support, the benefits of SSS 2.0 may remain uneven.
9.5 Methodological comparability
The use of different data sources and estimation techniques can affect comparability across States and over time.
Common standards, metadata and transparent methodologies are necessary.
9.6 AI-related risks
AI and machine-learning systems may introduce bias, classification errors or opaque decision-making.
Statistical authorities must ensure that automated processes remain auditable and that final official estimates are supported by sound statistical methodology.
9.7 Timely implementation of the Economic Census
The Economic Census requires extensive coordination between the Centre, States and local institutions.
Accurate enumeration of dispersed and informal establishments will require trained field personnel, effective supervision and robust verification.
10. Way Forward
To realise the objectives of VISTAR, India needs an integrated approach to statistical modernisation.
- Strengthen statistical independence and credibility: Ensure that statistical methods, revisions and publications follow transparent professional standards.
- Invest in human resources: Build the capacity of statisticians, data scientists, survey investigators and State statistical personnel.
- Adopt privacy-preserving data systems: Ensure that the use of alternative data is consistent with legal safeguards and responsible data governance.
- Improve survey methodology: Use appropriate sampling, validation and estimation methods to ensure that expanded data collection produces reliable results.
- Strengthen Centre-State coordination: Establish common standards and provide sustained technical assistance to States and UTs.
- Integrate administrative and survey data carefully: Use alternative sources to complement rather than mechanically replace representative surveys.
- Ensure transparent AI use: Make statistical algorithms auditable, explainable and subject to human oversight.
- Improve public access to data: Disseminate statistics in machine-readable, accessible formats with adequate metadata and documentation.
- Link data with policy outcomes: Ensure that improved statistics are actually used for planning, monitoring and evaluation at national, state and local levels.
11. Conclusion
The VISTAR Scheme represents an important attempt to strengthen the institutional and technological foundations of India’s official statistical system.
Its emphasis on expanded surveys, AI-assisted statistical processes, alternative data sources, state-level capacity building and the 8th Economic Census reflects the changing requirements of a complex and increasingly digital economy.
The most important outcome should not simply be the generation of larger volumes of data. It should be the production of reliable, timely, comparable and policy-relevant statistics that improve the quality of public decision-making.
For a country aspiring to become a developed economy by 2047, the ability to measure economic and social progress accurately is indispensable.
A development strategy can be effective only when progress, inequalities and emerging challenges can be measured with credibility. VISTAR therefore has the potential to become an important foundation for evidence-based governance and inclusive development.
UPSC Examination Relevance
GS Paper II – Governance
- E-governance and digital public infrastructure.
- Institutional capacity and administrative reforms.
- Transparency and accountability.
- Evidence-based policymaking.
- Centre-State coordination.
GS Paper III – Indian Economy
- National income accounting.
- GDP and economic measurement.
- Employment and unemployment statistics.
- Informal and unorganised sector.
- Economic Census.
- Data-driven economic planning.
- Application of AI and big data in governance.
Essay Paper
- Data as the foundation of good governance.
- Measuring development beyond economic growth.
- Technology, evidence and public policy.
- Statistical capacity and inclusive development.
Prelims Practice Questions
Q1. With reference to the VISTAR Scheme, consider the following statements:
- It is a Central Sector Scheme under the Ministry of Statistics and Programme Implementation.
- It is scheduled to operate from 2026–27 to 2030–31.
- It includes the conduct of the 8th Economic Census.
- It seeks to strengthen statistical capacity in States and Union Territories.
Which of the statements given above are correct?
(a) 1 and 2 only
(b) 1, 2 and 3 only
(c) 2, 3 and 4 only
(d) 1, 2, 3 and 4
Answer: (d) 1, 2, 3 and 4
Explanation: All four statements are correct. VISTAR is a Central Sector Scheme with three major components, including statistical operations, SSS 2.0 and the Economic Census.
Q2. Consider the following statements about the Economic Census:
- It provides information about economic establishments in the country.
- It includes establishments in the unorganised sector.
- It is primarily designed to enumerate individual persons and households.
- It can provide a basis for developing a Statistical Business Register.
Which of the statements given above are correct?
(a) 1 and 2 only
(b) 1, 2 and 4 only
(c) 2 and 3 only
(d) 1, 2, 3 and 4
Answer: (b) 1, 2 and 4 only
Explanation: An Economic Census focuses on economic establishments, not on the enumeration of individual persons and households. It includes establishments in the unorganised sector and can provide the foundation for a Statistical Business Register.
Q3. Which of the following are potential applications of alternative data sources in official statistics?
- Retail scanner data for analysing consumption patterns.
- Mobile phone data for studying mobility patterns.
- E-commerce data for analysing online economic activity.
Select the correct answer:
(a) 1 only
(b) 1 and 2 only
(c) 2 and 3 only
(d) 1, 2 and 3
Answer: (d) 1, 2 and 3
Explanation: All three are potential alternative data sources. They can complement conventional surveys, subject to representativeness, validation and privacy safeguards.
Mains Practice Question
“Reliable and granular official statistics are essential for evidence-based policymaking and inclusive development.” Discuss how the VISTAR Scheme seeks to transform India’s statistical ecosystem. Examine the challenges associated with the use of AI and alternative data sources. (15 marks)
Key dimensions for an answer: Importance of official statistics, objectives of VISTAR, three components, 8th Economic Census, state-level statistical strengthening, AI and alternative data, privacy concerns, methodological reliability, Centre-State coordination and way forward.
Keywords for Mains: Statistical capacity, data governance, evidence-based policymaking, data interoperability, statistical business register, alternative data, data granularity, privacy by design, unorganised sector and decentralised planning.</WritingBlock}