
Introduction
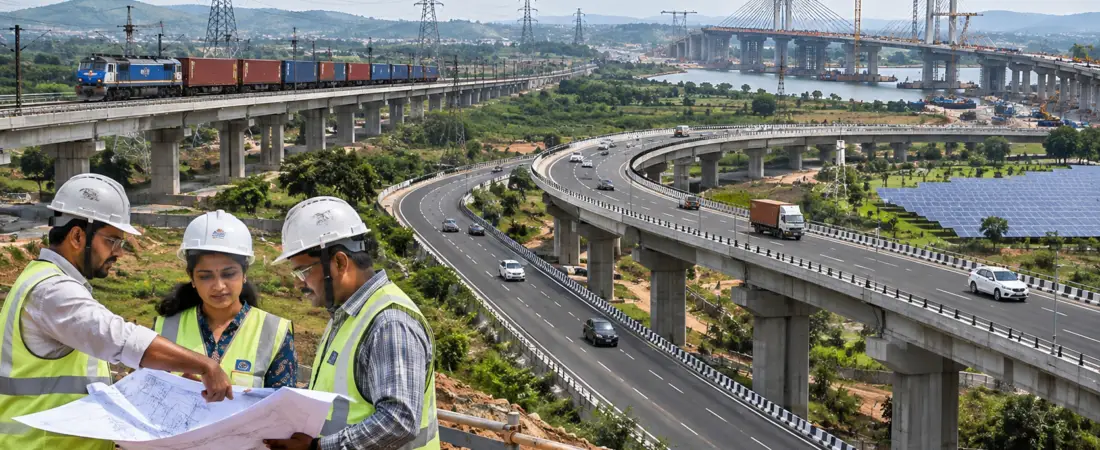
Infrastructure is a critical foundation of economic development. Roads, railways, ports, airports, electricity networks, telecommunications, irrigation systems and urban infrastructure reduce the cost of economic activity, improve connectivity, facilitate investment and enhance the productivity of the economy.
For a country such as India, which is seeking to sustain high economic growth and become a developed economy by 2047, the timely implementation of infrastructure projects is as important as the mobilisation of financial resources.
However, infrastructure development involves complex processes: land acquisition, environmental clearances, financing, inter-ministerial coordination, procurement, construction, technology adoption and project monitoring. Delays in any of these stages can increase costs, postpone economic benefits and reduce the efficiency of public investment.
In this context, the Ministry of Statistics and Programme Implementation (MoSPI) released its Monthly Flash Report on Central Sector Infrastructure Projects for September 2026 on 26 October 2026.
The report monitors 1,853 ongoing central sector infrastructure projects, with a combined latest project cost of ₹37.56 lakh crore. Cumulative expenditure on these projects stood at ₹17.73 lakh crore, equivalent to approximately 47.21 per cent of their latest aggregate cost.
The report is significant because it provides a consolidated picture of the scale, sectoral distribution and implementation status of major infrastructure projects being monitored by the Union Government.
It also highlights the importance of data-driven project monitoring through the PAIMANA-PROJ platform and the underlying PAIMANA-CRIP data repository.
This article examines the report’s key findings, explains the data and monitoring framework, and analyses what the numbers reveal about India’s infrastructure development strategy.
1. About the MoSPI Monthly Flash Report
1.1 What is the Monthly Flash Report?
The Monthly Flash Report is a monitoring publication of the Ministry of Statistics and Programme Implementation that provides information on major Central Sector Infrastructure Projects.
It presents consolidated information on:
- Number of ongoing projects.
- Latest estimated project cost.
- Cumulative expenditure.
- Ministry-wise distribution.
- Sector-wise distribution.
- Physical progress.
- Financial progress.
- Newly onboarded projects.
- Projects commissioned or completed.
The report helps the Government monitor the implementation of major infrastructure projects and identify areas requiring administrative attention.
1.2 Scope of the September 2026 report
The September 2026 report covers selected Central Sector Infrastructure Projects with an individual project cost of ₹150 crore and above.
The projects are reported by the concerned Union ministries and departments and monitored through MoSPI’s project-monitoring system.
The report covers 1,853 ongoing projects across 17 Union ministries and departments.
Important clarification: The report does not cover every infrastructure project in India. It covers selected projects within its defined monitoring framework. It should not be interpreted as a complete inventory of all public and private infrastructure investment in the country.
1.3 Institutional background
MoSPI undertakes statistical monitoring and reporting of major central infrastructure projects.
The monitoring framework has evolved through the PAIMANA platform.
The current institutional architecture includes:
- PAIMANA-PROJ: The project-monitoring interface used to track infrastructure projects.
- PAIMANA-CRIP: The Central Repository of Infrastructure Projects, launched in July 2026, which serves as the underlying data repository and input layer.
The Government has stated that nearly 80 per cent of data updates are received through application programming interfaces (APIs) on the PAIMANA-CRIP portal.
This is intended to improve standardisation, data integration and the availability of information for project monitoring.
2. Key Findings of the September 2026 Report
The report presents several important indicators of India’s central infrastructure investment pipeline.
2.1 Overall project status
| Indicator | September 2026 |
|---|---|
| Ongoing projects monitored | 1,853 |
| Latest aggregate project cost | ₹37.56 lakh crore |
| Cumulative expenditure | ₹17.73 lakh crore |
| Expenditure as a percentage of latest project cost | 47.21% |
| Projects with more than 80% physical progress | 654 |
| Projects with more than 80% financial progress | 338 |
| Mega projects costing ₹1,000 crore and above | 780 |
| Major projects costing below ₹1,000 crore | 1,073 |
The report indicates that the infrastructure pipeline includes projects at different stages of implementation.
A substantial number of projects are approaching advanced physical completion, while others remain at early stages.
The distinction between physical and financial progress is important. A project may have completed a significant proportion of its construction work without having incurred a proportionate share of its total financial cost. Conversely, substantial expenditure may occur during the initial stages because of land acquisition, equipment procurement, mobilisation advances or other upfront costs.
Therefore, financial expenditure alone cannot establish whether a project is physically complete or operational.
2.2 Concentration of projects in transport and energy
Transport and logistics account for the largest share of monitored projects.
| Sector | Number of projects | Latest project cost |
|---|---|---|
| Transport and Logistics | 1,320 | ₹20.07 lakh crore |
| Energy | 225 | ₹11.04 lakh crore |
| Water and Sanitation | 50 | ₹1.99 lakh crore |
| Social and Commercial Infrastructure | 79 | ₹0.95 lakh crore |
| Communication | 31 | ₹1.34 lakh crore |
| Others | 148 | ₹2.17 lakh crore |
| Total | 1,853 | ₹37.56 lakh crore |
Transport and logistics account for approximately 71.2 per cent of the total number of projects.
Energy accounts for approximately 12.1 per cent.
Together, these two sectors account for 1,545 projects, or 83.4 per cent of the monitored project count.
Their combined importance reflects India’s emphasis on connectivity, logistics efficiency and energy infrastructure as foundations of economic growth.
3. Sector-wise Analysis of Infrastructure Projects
3.1 Transport and Logistics
Transport and logistics constitute the largest category in the report.
The sector includes:
- Roads and highways.
- Railways.
- Urban public transport.
- Aviation and aviation infrastructure.
- Shipping.
- Logistics infrastructure.
The report monitors 1,320 projects in this category, with a combined latest cost of ₹20.07 lakh crore.
Roads and highways account for the largest number of projects, followed by railways.
| Sub-sector | Projects | Project cost |
|---|---|---|
| Roads and Highways | 974 | ₹9.46 lakh crore |
| Railways | 286 | ₹7.26 lakh crore |
| Urban Public Transport | 29 | ₹3.02 lakh crore |
| Aviation and Aviation Infrastructure | 25 | ₹23,141 crore |
| Shipping | 5 | ₹8,703 crore |
| Logistics Infrastructure | 1 | ₹763 crore |
The cumulative expenditure in the transport and logistics category stands at approximately ₹10.24 lakh crore, equivalent to 51.03 per cent of the latest project cost.
Economic significance
Transport infrastructure contributes to economic growth through several channels:
- Reduction in logistics costs: Better road, rail and port connectivity reduces the time and cost of moving goods.
- Market integration: Improved connectivity links producers with domestic and international markets.
- Industrial development: Transport corridors encourage industrial clusters and manufacturing activity.
- Employment generation: Construction, operation and maintenance create direct and indirect employment.
- Regional development: Better connectivity can improve access to markets, education, healthcare and employment opportunities.
However, the concentration of projects in transport infrastructure also highlights the need to ensure that other critical sectors receive adequate investment.
3.2 Energy Infrastructure
Energy is the second-largest category in terms of project cost.
The report monitors 225 energy projects, with a combined latest cost of approximately ₹11.04 lakh crore.
The category includes:
- Oil and gas.
- Electricity generation.
- Transmission and distribution.
- Energy storage.
| Sub-sector | Projects | Project cost |
|---|---|---|
| Oil and Gas | 102 | ₹4.01 lakh crore |
| Transmission and Distribution | 72 | ₹2.47 lakh crore |
| Electricity Generation | 38 | ₹4.27 lakh crore |
| Energy Storage | 13 | ₹28,874 crore |
Cumulative expenditure stands at approximately ₹4.37 lakh crore, representing 39.58 per cent of the latest project cost.
The energy category is particularly important because India’s economic expansion will require reliable, affordable and sustainable energy.
The development of generation capacity must be accompanied by investment in transmission networks, distribution systems and energy storage.
For renewable energy, the availability of storage and grid infrastructure is essential to manage the variable nature of solar and wind power.
Analytical significance: Infrastructure planning must move beyond the creation of generation capacity towards the development of an integrated energy system comprising generation, transmission, distribution and storage.
3.3 Water and Sanitation
The Water and Sanitation category includes 50 projects with a combined latest cost of approximately ₹1.99 lakh crore.
Cumulative expenditure is approximately ₹1.41 lakh crore.
The expenditure-to-cost ratio of this category is around 70.81 per cent, the highest among the major categories in the report’s narrative analysis.
The category includes:
- Water resources projects.
- Waste and water infrastructure.
Water infrastructure is critical for:
- Irrigation.
- Drinking water supply.
- Industrial development.
- Urban water management.
- Flood control.
- Water security.
- Wastewater treatment.
The relatively high expenditure ratio suggests substantial cumulative financial utilisation in this category. However, it should not automatically be interpreted as proof that all projects are physically complete or delivering services.
Project-level physical progress, commissioning and service outcomes must also be examined.
3.4 Social and Commercial Infrastructure
This category comprises 79 projects with a combined latest cost of approximately ₹95,348 crore.
It includes:
- Education.
- Healthcare.
- Real estate.
- Tourism, hospitality and wellness.
Cumulative expenditure stands at approximately ₹39,782 crore.
Social infrastructure is essential because economic development cannot be measured only through roads, power generation and industrial investment.
Investment in schools, hospitals, healthcare facilities and tourism infrastructure improves human development and creates the conditions for inclusive growth.
For example, healthcare infrastructure can improve access to medical services, while educational infrastructure strengthens human capital formation.
The relatively smaller share of social and commercial infrastructure in the monitored project pipeline raises the importance of assessing whether public investment is adequately balanced between economic and social infrastructure.
3.5 Communication Infrastructure
The communication category includes 31 telecommunications projects with a combined latest cost of approximately ₹1.34 lakh crore.
Cumulative expenditure is around ₹65,064 crore, equivalent to approximately 48.66 per cent of the latest project cost.
Communication infrastructure is important for:
- Digital connectivity.
- Broadband expansion.
- 5G and future communication networks.
- Digital public infrastructure.
- E-governance.
- Financial inclusion.
- Digital service delivery.
As the economy becomes increasingly dependent on digital systems, communication infrastructure is no longer merely a support sector. It is a foundational component of economic productivity and national competitiveness.
3.6 Other Infrastructure Projects
The category includes 148 projects with a combined latest cost of approximately ₹2.17 lakh crore.
It covers projects in sectors such as:
- Coal.
- Steel.
- Metals and mining.
- Construction.
These sectors support industrial production and the supply of essential inputs for infrastructure development.
For example, steel is required for bridges, railways, buildings and industrial facilities, while coal remains relevant to India’s energy and industrial systems.
The category’s expenditure-to-cost ratio is approximately 30.67 per cent, indicating a relatively lower cumulative expenditure share compared with several other categories.
However, the reasons for this pattern must be examined through project-level information rather than inferred from the aggregate ratio alone.
4. Ministry-wise Distribution of Projects
The report also provides a ministry-wise picture of infrastructure investment.
| Ministry / Department | Projects | Latest project cost |
|---|---|---|
| Road Transport and Highways | 974 | ₹9.46 lakh crore |
| Railways | 284 | ₹7.21 lakh crore |
| Coal | 121 | ₹2.22 lakh crore |
| Petroleum and Natural Gas | 115 | ₹4.30 lakh crore |
| Power | 106 | ₹6.40 lakh crore |
| Housing and Urban Affairs | 49 | ₹3.41 lakh crore |
| Water Resources | 35 | ₹1.95 lakh crore |
| Telecommunications | 31 | ₹1.34 lakh crore |
The Ministry of Road Transport and Highways accounts for the highest number of monitored projects.
The Ministry of Railways is another major contributor to the infrastructure pipeline.
The Ministry of Power has a comparatively smaller number of projects than the transport ministries but accounts for a substantial aggregate project cost.
This illustrates an important distinction: the number of projects and the financial scale of projects are not the same indicator.
A ministry with fewer projects may still be implementing projects with substantially higher individual costs.
5. Project Monitoring: Understanding Physical and Financial Progress
One of the most important aspects of the report is its distinction between physical progress and financial progress.
5.1 What is physical progress?
Physical progress measures the actual completion of project activities.
For example, in a highway project, physical progress may be assessed through:
- Land acquisition.
- Earthwork.
- Construction of bridges and culverts.
- Road pavement.
- Installation of safety systems.
- Completion of project sections.
In a power project, physical progress may involve equipment installation, construction of generation facilities, transmission lines and commissioning activities.
5.2 What is financial progress?
Financial progress measures expenditure incurred against the relevant project cost.
It provides information on the utilisation of financial resources.
However, expenditure may not always move proportionately with physical progress.
For example:
- Land acquisition costs may be incurred early in a project.
- Machinery and equipment may require substantial advance payments.
- Construction expenditure may be concentrated in later stages.
- Delays in contractor payments may affect recorded expenditure.
5.3 Why must both indicators be examined?
Consider a hypothetical infrastructure project with a total cost of ₹1,000 crore.
If expenditure of ₹600 crore has been incurred, the financial expenditure ratio is 60 per cent.
However, this does not establish that 60 per cent of the physical work has been completed.
Physical progress may be higher or lower depending on the nature of expenditure and construction activities.
Therefore, a comprehensive assessment of project implementation must examine:
- Financial expenditure.
- Physical completion.
- Quality of construction.
- Time taken for implementation.
- Commissioning and operational readiness.
- Actual economic and social outcomes.
Important for UPSC: The report’s aggregate expenditure of 47.21 per cent is not equivalent to 47.21 per cent physical completion of India’s monitored infrastructure projects.
6. PAIMANA: Technology-driven Infrastructure Monitoring
The September 2026 report highlights the role of PAIMANA-PROJ and PAIMANA-CRIP in strengthening infrastructure monitoring.
6.1 PAIMANA-PROJ
PAIMANA-PROJ is the project-monitoring interface through which information on major infrastructure projects is tracked.
It supports the monitoring of:
- Project costs.
- Financial expenditure.
- Physical progress.
- Project implementation.
- Ministry-wise performance.
- Sector-wise progress.
6.2 PAIMANA-CRIP
The Central Repository of Infrastructure Projects (PAIMANA-CRIP) was launched by MoSPI in July 2026.
It functions as the underlying data repository and input layer for standardised infrastructure monitoring.
The Government has indicated that nearly 80 per cent of data updates are received through APIs on the PAIMANA-CRIP portal.
This can help improve data integration across ministries and departments.
6.3 Significance of digital project monitoring
Digital monitoring can improve infrastructure governance through:
A. Data standardisation: Common data structures can improve comparability across ministries.
B. Timely information: Regular updates can help identify delays and implementation bottlenecks.
C. Inter-ministerial coordination: Infrastructure projects often depend on multiple agencies. A shared data system can improve coordination.
D. Evidence-based decision-making: Administrators can use project-level information to identify areas requiring corrective action.
E. Transparency and accountability: Better information can strengthen monitoring of public investment.
However, the quality of a digital monitoring system ultimately depends on the accuracy, completeness and timeliness of the data supplied by implementing agencies.
7. Projects Completed and Newly Onboarded
The September 2026 report also identifies projects commissioned during the month and projects newly added to the monitoring system.
7.1 Notable commissioned projects
Some notable projects reported as commissioned during September 2026 include:
- Buxar Thermal Power Project: A 1,320 MW project with a reported cost of ₹13,756.56 crore.
- NMDC Slurry Pipeline Project Phase-I: A project with a reported cost of ₹5,427 crore.
- Delhi–Amritsar–Katra Expressway Phase-I, Package-I: A project with a reported cost of ₹2,429.9 crore.
These projects demonstrate the diversity of infrastructure being monitored, ranging from power generation and mineral logistics to highway connectivity.
7.2 Newly onboarded projects
During September 2026, 83 additional projects were onboarded under the PAIMANA monitoring framework.
These included projects from:
- Ministry of Railways.
- Ministry of Road Transport and Highways.
- Ministry of Power.
- Ministry of Ports, Shipping and Waterways.
- Ministry of Coal.
The onboarding of additional projects is important because the monitoring pipeline changes over time as new projects are added and completed projects exit the ongoing-project category.
Consequently, month-to-month comparisons should account for changes in the composition of the monitored project universe.
8. What Does the Report Reveal About India’s Infrastructure Strategy?
The data provides several insights into the direction of India’s infrastructure development.
8.1 Connectivity remains a major investment priority
The dominance of transport and logistics projects indicates the importance assigned to improving physical connectivity.
Roads, railways, ports and logistics facilities are essential for reducing transportation costs and improving the movement of goods and people.
8.2 Energy infrastructure remains a major investment requirement
The large project cost associated with energy indicates the capital-intensive nature of the sector.
India’s energy transition will require investment in conventional generation, renewable energy, transmission networks, distribution systems and storage.
8.3 Infrastructure development requires integrated planning
Transport, energy, communication and industrial infrastructure are interconnected.
For example, an industrial corridor requires road and rail connectivity, electricity, water, logistics facilities and digital infrastructure.
Planning these assets independently can create coordination problems and increase project costs.
Integrated planning frameworks such as PM GatiShakti are important in this context.
8.4 Monitoring must move beyond expenditure
The report provides important information on expenditure and physical progress.
However, the ultimate objective of infrastructure investment is the delivery of economic and social services.
A completed road must improve connectivity. A power project must supply electricity. A hospital must deliver healthcare services.
Therefore, infrastructure monitoring must increasingly focus on outcomes and service delivery, rather than only expenditure and construction progress.
9. Major Challenges in Infrastructure Project Implementation
Despite the scale of investment, infrastructure projects in India face several structural challenges.
9.1 Land acquisition
Land acquisition can cause substantial delays, particularly in road, railway, industrial and urban infrastructure projects.
Disputes relating to compensation, ownership, rehabilitation and resettlement can affect implementation schedules.
9.2 Environmental and forest clearances
Infrastructure projects may require environmental approvals, forest clearances and other statutory permissions.
Delays can arise when project planning does not adequately account for ecological constraints and regulatory requirements.
The solution is not to weaken environmental safeguards, but to improve early-stage planning, assessment and coordination.
9.3 Financing constraints
Large infrastructure projects require substantial long-term finance.
Delays in fund availability, changes in project costs and financing difficulties can affect implementation.
9.4 Coordination among agencies
A single project may involve multiple ministries, State Governments, local bodies, regulators, contractors and utility providers.
Lack of coordination can delay land transfer, utility shifting, clearances and construction.
9.5 Cost and time overruns
Delays can increase project costs through inflation, interest during construction, contractual claims and changes in project scope.
A project that is completed late may also postpone the economic benefits expected from it.
9.6 Quality and maintenance
Infrastructure development must focus not only on creating new assets but also on ensuring construction quality, maintenance and long-term operational sustainability.
Poor maintenance can reduce the useful life of public assets and increase the future fiscal burden.
9.7 Uneven regional distribution
Infrastructure investment must be evaluated in terms of regional equity.
Less-developed regions may require greater attention to basic connectivity, power, water, health and education infrastructure.
A purely project-count-based approach may not capture differences in regional needs or development outcomes.
10. Way Forward: Improving Infrastructure Governance
The findings of the report point towards the need for a stronger infrastructure governance framework.
10.1 Strengthen project preparation
Detailed project reports should be based on realistic cost estimates, adequate surveys, land availability and environmental assessment.
Better preparation can reduce the risk of delays after project approval.
10.2 Improve coordination through integrated planning
Platforms such as PM GatiShakti should be used to improve coordination among ministries and agencies.
Infrastructure planning must consider the interdependence of transport, energy, water, communication and industrial assets.
10.3 Use digital monitoring for early intervention
PAIMANA-PROJ and PAIMANA-CRIP can strengthen monitoring if project data is updated regularly and verified.
Monitoring systems should identify early warning signals relating to delays, cost escalation and implementation bottlenecks.
10.4 Improve financing mechanisms
Infrastructure financing should use an appropriate combination of budgetary resources, institutional finance, development finance, bonds and carefully structured public-private partnerships.
The financing model must reflect the revenue-generating capacity and risk profile of individual projects.
10.5 Strengthen accountability
Project authorities, contractors and implementing agencies should be accountable for agreed timelines, quality standards and financial performance.
Periodic independent audits and transparent reporting can improve public confidence.
10.6 Focus on outcomes and asset utilisation
The success of infrastructure investment should be measured through indicators such as:
- Reduction in travel time.
- Lower logistics costs.
- Improved electricity reliability.
- Increased access to drinking water.
- Better access to healthcare and education.
- Improved regional connectivity.
- Higher productive capacity.
10.7 Incorporate environmental sustainability
Infrastructure planning should consider climate resilience, biodiversity, resource efficiency and disaster risk.
Sustainable infrastructure can reduce long-term costs and protect public investments against climate-related disruptions.
11. Critical Assessment
The September 2026 MoSPI Flash Report provides a useful snapshot of India’s major central infrastructure project pipeline.
Its importance lies in the scale of investment being monitored and the level of sectoral detail made available.
However, several qualifications are necessary while interpreting the data.
First, coverage is limited. The report covers selected central sector projects costing ₹150 crore and above. It does not represent the entire infrastructure investment ecosystem, including all State Government, local body and private-sector projects.
Second, expenditure is not the same as completion. The 47.21 per cent expenditure ratio cannot be interpreted as the percentage of physical completion.
Third, project cost is a changing figure. The report uses the latest available project cost. A comparison with earlier reports must consider revisions in project estimates and changes in the project portfolio.
Fourth, the number of projects does not indicate their economic importance. A ministry with fewer projects may account for a larger share of total investment because its projects are more capital-intensive.
Fifth, monitoring must be linked to outcomes. Project expenditure and construction progress are intermediate indicators. The ultimate test is whether completed infrastructure improves productivity, connectivity, welfare and economic competitiveness.
Thus, the report should be read as a project-monitoring instrument, not as a complete assessment of India’s infrastructure performance.
Conclusion
The September 2026 MoSPI Flash Report highlights the scale and sectoral composition of India’s central infrastructure investment pipeline. With 1,853 monitored projects and a combined latest cost of ₹37.56 lakh crore, it demonstrates the central role of infrastructure in India’s development strategy.
The report also underlines the importance of project monitoring, digital data integration and inter-ministerial coordination.
However, the success of infrastructure-led growth cannot be measured only by the amount of money spent or the number of projects initiated. It depends on timely completion, construction quality, efficient asset utilisation, environmental sustainability and measurable improvements in public services and economic productivity.
India’s infrastructure challenge is therefore not merely to build more assets, but to build the right assets, complete them on time and ensure that they deliver lasting economic and social value.
UPSC Examination Relevance
General Studies Paper III: Infrastructure – energy, ports, roads, airports, railways; investment models; mobilisation of resources; economic development.
General Studies Paper II: Government policies and interventions; transparency and accountability; e-governance; institutional coordination.
Essay: Infrastructure as the foundation of economic development; public investment and inclusive growth; technology in governance.
Prelims Practice Questions
1. With reference to the September 2026 Monthly Flash Report on Central Sector Infrastructure Projects, consider the following statements:
- It is released by the Ministry of Statistics and Programme Implementation.
- It covers selected Central Sector Infrastructure Projects costing ₹150 crore and above.
- It provides information on both physical and financial progress of projects.
Which of the statements given above are correct?
(a) 1 and 2 only
(b) 2 and 3 only
(c) 1 and 3 only
(d) 1, 2 and 3
2. Consider the following statements regarding PAIMANA-CRIP:
- It serves as the Central Repository of Infrastructure Projects.
- It is intended to support standardised infrastructure project monitoring.
- It is an institution responsible for financing infrastructure projects.
Which of the statements given above are correct?
(a) 1 and 2 only
(b) 2 and 3 only
(c) 1 and 3 only
(d) 1, 2 and 3
3. Which of the following statements best explains the difference between financial progress and physical progress in an infrastructure project?
(a) Financial progress measures the percentage of project activities completed, while physical progress measures expenditure incurred.
(b) Financial progress measures expenditure incurred, while physical progress measures the actual completion of project activities.
(c) Both indicators necessarily increase at the same rate.
(d) Physical progress can be measured only after the project is commissioned.
Mains Practice Questions
1. The September 2026 MoSPI Flash Report highlights the scale of India’s central infrastructure investment pipeline. Examine the significance of infrastructure investment for economic growth and discuss the major challenges in project implementation. (15 marks)
2. Digital project-monitoring platforms can improve transparency, coordination and accountability in public infrastructure development. Discuss with reference to PAIMANA-PROJ and PAIMANA-CRIP. (10 marks)
3. Infrastructure development should be assessed not merely in terms of expenditure incurred but also in terms of physical completion and socio-economic outcomes. Examine. (15 marks)
Key Terms for Revision
- Central Sector Scheme / Project: A project implemented and financed by the Union Government through the concerned central ministry or department.
- Physical progress: The extent of actual completion of project activities.
- Financial progress: Expenditure incurred in relation to the relevant project cost.
- Cost overrun: An increase in the cost of a project beyond its originally estimated or approved cost.
- Time overrun: Delay in completion beyond the scheduled implementation period.
- PAIMANA-PROJ: MoSPI’s project-monitoring interface for major infrastructure projects.
- PAIMANA-CRIP: Central Repository of Infrastructure Projects, serving as the underlying data repository.
- PM GatiShakti: National Master Plan for multi-modal connectivity and integrated infrastructure planning.
- Public-Private Partnership: A contractual arrangement through which public and private entities share responsibilities, investment and risks in delivering infrastructure or public services.